Every few years, someone in this industry says the sky is falling, and every few years, they're partly right and mostly wrong. Foodservice took a real hit in 2008 and 2009. It took a much bigger one in 2020. Both times, the industry came back, not unscathed, and not looking exactly the same, but back. So before anyone declares 2026 a crisis on par with either of those, it's worth doing the thing the industry rarely does in the moment: look at what actually happened last time, and the time before that, and ask whether this one rhymes.
It rhymes in places. It doesn't rhyme everywhere. That gap is the interesting part.
How foodservice and the economy actually move together
Restaurants sit at an unusual spot in the household budget: genuinely discretionary, but sticky. Nobody needs to eat out. Almost everybody wants to, badly enough that dining spending is one of the last things cut and one of the first things restored. That combination is what makes the industry a decent, if noisy, read on the broader economy, traffic and average check tend to soften a quarter or two before broader consumer distress shows up in harder data, and restaurant stocks are often among the first to recover once a downturn bottoms out, according to sell-side analysts who cover the sector.
The relationship isn't simple. Full-service and casual dining track discretionary income closely, they're the first to lose traffic when budgets tighten and the first to gain it back when confidence returns. Quick-service is more complicated: it benefits from trade-down when full-service diners get squeezed, but its own core customer skews toward the households under the most pressure, so it can lose ground even while gaining share from fancier competitors. Segment mix, in other words, tells you as much about the state of the economy as topline industry sales do. Keep that in mind, it matters for what's happening in 2026.
There's also a nominal-versus-real gap that shows up in every one of these cycles and is worth understanding before looking at any of them individually. Industry-wide, 2025's total real growth, adjusted for inflation, came in at just 0.8%, against 4.6% nominal growth, per IFMA's Landscape data [1]. That four-point gap is menu pricing, not additional demand. It's a pattern that recurs almost every time this industry goes through a rough stretch: nominal sales keep climbing because operators raise prices to cover costs, while the number that actually reflects more people eating more food stays flat or falls. Reading industry health off the nominal number alone is the single easiest mistake to make in any of these comparisons.
2008 to 2009: the demand shock, and the long climb back
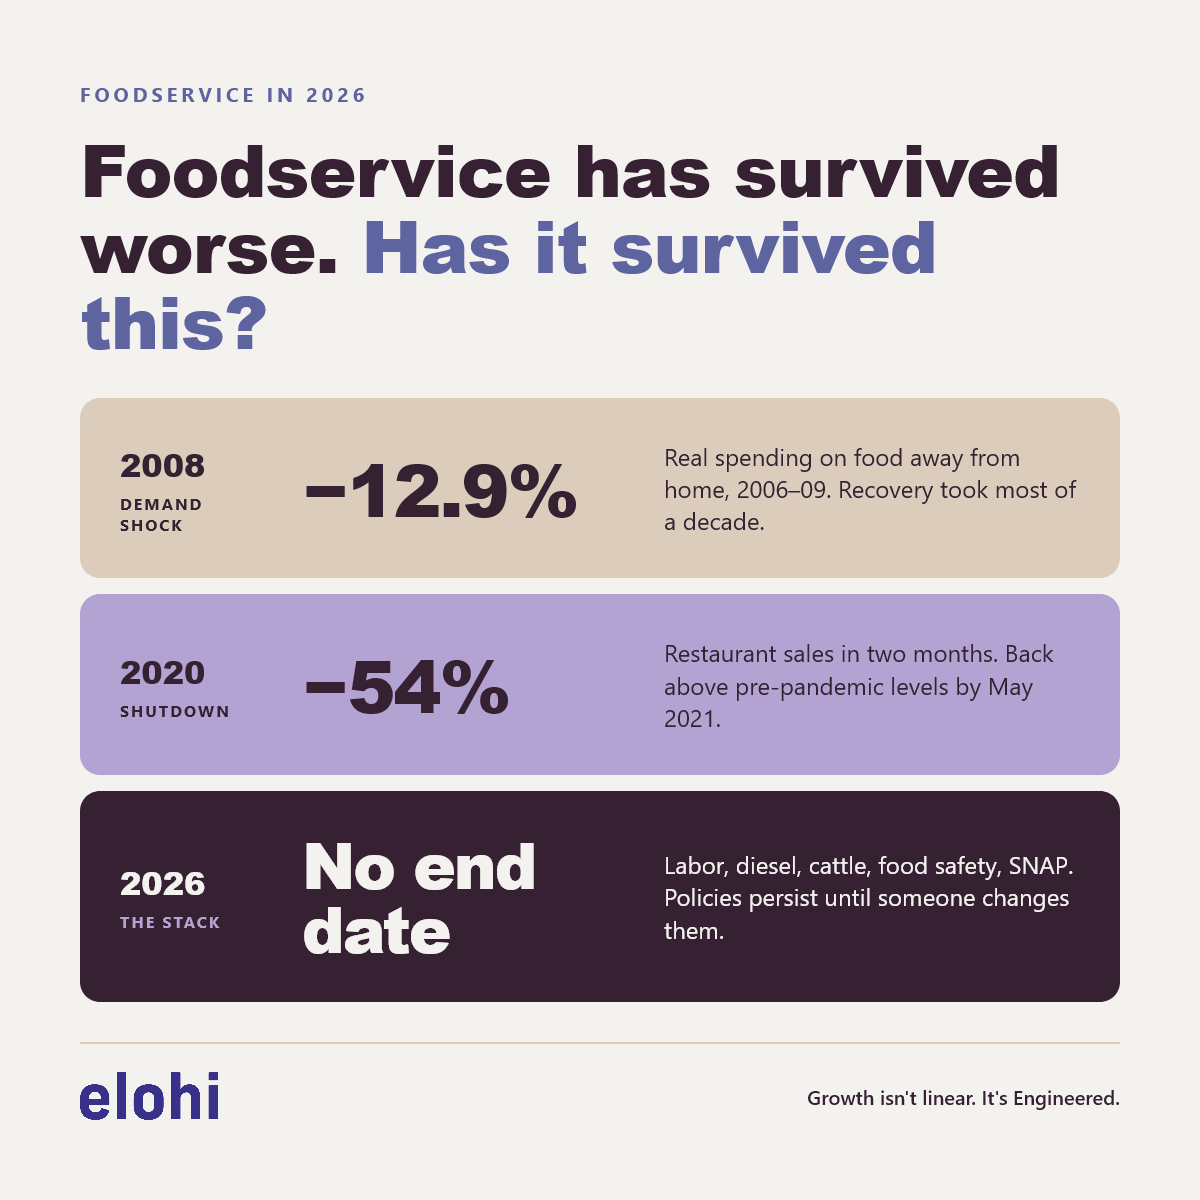
The Great Recession hit foodservice through the front door: household wealth and income fell, and people ate out less because they had less. Real per-capita spending on food away from home fell 12.9% between 2006 and 2009, according to USDA's Economic Research Service, more than four times the 1.6% decline in at-home food spending over the same stretch [2]. National unemployment rose from 4.6% in 2006 to a 2009 average of 9.3%. Real median household income fell from roughly $60,500 to $59,100 (in 2006 dollars) [2].
The industry felt it unevenly. Full-service and fine dining took the worst of it: independent fine-dining units fell 7% between 2008 and 2009, and total restaurant count dropped about 1%, to just over 577,000 locations, per NPD Group data [3]. Casual-dining stocks were hammered, Ruby Tuesday's shares fell 85% in 2008, Cheesecake Factory's fell 60%, and the parent of Bennigan's and Steak & Ale filed for bankruptcy [4, 5]. The National Restaurant Association's own 2009 forecast projected nominal sales growth of 2.5% against a real, inflation-adjusted decline of 1.0% [6], the same nominal-versus-real gap that shows up in the industry's numbers again in 2025 and 2026, for different reasons [1].
And yet: restaurant spending was the only major consumer category to grow in 2008 versus 2007, according to a MasterCard SpendingPulse survey cited by Forbes, even as home values and jobs disappeared [7]. Consumers didn't stop eating out. They traded down hard, Q4 2008 spending shifted decisively toward fast food and away from sit-down dining, an early signal of the value-seeking that would define the whole recovery [4, 5]. The eventual rebound was slow and structural rather than sharp: it took most of a decade for the industry to fully reset. By 2017 to 2018, restaurant sales had climbed to roughly $799 billion, up 36% since 2010, and the industry had added more than two million jobs, raising restaurant employment from under 7% of the U.S. workforce to 8% [8]. Fast casual, barely a category in 2008, grew from 7% to 13% of Top 500 chain sales over the same period [8]. The recession didn't just hurt the industry; it reshaped which parts of it grew afterward.
2020 to 2021: the regulatory shock, and the fast bounce
COVID hit through a completely different door: not a slow bleed in household wealth, but an overnight, government-mandated shutdown of the core product, sitting down and eating in a room with other people. Restaurant sales fell from $69 billion in February 2020 to $31 billion in April, a 54% collapse in two months [9]. Nearly half of the industry's roughly 13 million employees were out of work at the low point [9]. Full-year 2020 sales came in about $240 billion below where the National Restaurant Association had expected them to land, and the sector finished the year almost 2.5 million jobs, or 20%, below its pre-pandemic level, a bigger shortfall than any other industry in the country [10, 11, 12].
The difference from 2008 wasn't just the depth of the drop. It was the shape of the recovery, and the scale of what met it. Congress didn't just let the business cycle run its course the way it effectively had to in 2008, it built relief specifically sized to the shock: the CARES Act, hundreds of billions in Paycheck Protection Program loans that kept restaurant payrolls technically intact through the worst months, direct stimulus checks that gave households money to spend the moment dining rooms reopened, and eventually a $28.6 billion Restaurant Revitalization Fund built for this industry specifically [13]. Because the shock was a mandated closure rather than a genuine collapse in consumer appetite, the moment restrictions lifted and that money landed, spending snapped back hard. By May 2021, barely fourteen months after the low point, industry sales had already topped their pre-pandemic dollar level [14]. Consumers had never actually stopped wanting to eat out; they'd been prevented from doing it, and the desire was sitting there fully intact the moment they were allowed to act on it again. Today, Americans spend a larger share of their food dollar at restaurants than they did before the pandemic, 53%, up from 50% in 2019 [14]. COVID didn't just interrupt the industry. In the tally that actually matters longer-term, it left the channel bigger relative to grocery than it found it.
2026: same-sized shocks, a genuinely different shape
Here's where the comparison gets useful instead of just comforting. Both 2008 and 2020 were, in the end, single dateable shocks: a financial crisis with a starting point and a business cycle that eventually turns, or a public health emergency with a starting point and an eventual reopening. Both were met with historic, industry-relevant relief, TARP and years of near-zero interest rates after 2008; PPP, the Restaurant Revitalization Fund, and direct stimulus in 2020. In both cases, once the acute phase passed, the underlying machinery of the industry, labor supply, food safety oversight, input costs, the safety net, was basically intact and functioning the way it always had.
2026 doesn't have a single acute phase, and it isn't being met with anything like equivalent relief. What's hitting the industry right now is less a shock than a stack: a labor force that's short more than a million workers due to sharply reduced immigration and stepped-up worksite enforcement [15]; a diesel price that hit a nominal record above $6 a gallon after a war disrupted the Strait of Hormuz [16]; a cattle herd at a 74-year low, compounded by the return of New World screwworm for the first time in six decades [17, 18]; a federal food-safety apparatus that's lost tens of thousands of staff and had its lab-testing budget proposed for a 54% cut [19, 20]; and a consumer safety net, SNAP specifically, being reduced by $186 billion over the next decade [21] even as roughly half of renter households are already cost-burdened [22].
None of these five things has a natural expiration date the way a recession or a lockdown does. A business cycle turns on its own. A pandemic ends when the disease is controlled. Immigration enforcement policy, tariff schedules, agency staffing levels, and safety-net eligibility rules don't resolve themselves, they persist until someone with the authority to change them decides to. (INFERRED: I can't prove this is why the recovery pattern will look different this time, since it hasn't finished playing out yet. But the underlying mechanism is structurally distinct from either prior shock, and that's worth taking seriously rather than assuming the last two playbooks apply.)
The current headwinds, briefly
Without re-litigating each one in full: food-away-from-home inflation is running at 3.4% year-over-year [23]; beef prices are up double digits [18]; menu prices have risen enough that 82% of operators reported higher food costs last year and 90% of full-service operators raised menu prices in response; 42% of operators say their restaurant wasn't profitable in 2025 [24]; and GLP-1 medications, used by somewhere between 12% of adults and 23% of households, depending on whose survey you trust, are suppressing baseline demand in a way neither 2008 nor 2020 had to contend with [25, 26, 27, 28]. Consumer sentiment, per the University of Michigan index, sits nearly 30% below year-ago levels, and only 39% of Americans currently rate the economy "very good" or "somewhat good," per Ipsos [29].
Economists are also genuinely divided right now on how uneven the underlying consumer base actually is, and that division is worth carrying into any 2026 planning rather than picking a side. Bank of America has pointed to a "great convergence," with lower-income wage growth outpacing higher-income growth for the first time since late 2024 [30, 31]. Other economists describe the same data as turning "E-shaped", a stressed middle class alongside a struggling bottom and a comfortable top, rather than a clean two-tier split [32, 33]. Either way, the operators who serve middle- and lower-income households, family dining, value-tier casual, price-sensitive quick-service, are working with a less predictable customer than operators serving higher-income households, and that unpredictability is itself a planning variable, independent of which economic narrative turns out to be right.
Reasons this isn't a five-alarm fire
None of this means the industry is headed for a 2020-style collapse, and the data pushes back on that read fairly hard. Even the National Restaurant Association's most sobering recent survey, in which 49% of adults said they were struggling to keep up with basic expenses, found that 54% of those same financially strained consumers still ordered takeout or delivery, and 53% still went out to eat [34]. In the National Restaurant Association's Q2 2026 survey, 56% of consumers said they'd dined at a restaurant in the past week [34]. That's the same instinct that kept restaurant spending growing straight through 2008: people cut back on how they eat out before they stop doing it altogether, and they typically restore the habit before almost anything else once conditions improve even slightly.
The industry itself is also simply bigger and more diversified than it was in either prior downturn. Off-premises, delivery, and digital ordering, categories that barely existed in 2008 and were only beginning to mature in 2020, now give operators margin and reach that didn't exist in either previous cycle. Value-oriented segments have real room to gain share the way fast casual did after 2008. And unlike 2008 or 2020, this isn't primarily a demand problem to fix with stimulus; it's substantially a supply-side and cost problem, which means it's also, in principle, more directly responsive to specific policy choices, tariff schedules, enforcement posture, agency funding, than a business cycle or a virus ever was.
What this actually means for planning
The honest version of "this too shall pass" is: yes, probably, but not on the COVID timeline, and not automatically. There's no equivalent of a reopening date here, and no equivalent of a $1,200 stimulus check headed for household bank accounts. The 2008 comparison is closer, but even that recovery took most of a decade and reshaped which segments and formats came out ahead, value-forward, off-premise-capable, chain-scale operations gained relative to independent full-service, and that reshaping wasn't automatic either; it happened because certain operators built for the conditions that had actually changed, rather than waiting for the old ones to come back.
That's the useful takeaway here, and it's a more constructive one than either pure alarm or pure reassurance: the industry has been through worse, twice, and came back both times, but it came back looking different, not identical, and the operators, distributors, and manufacturers who fared best were the ones who read the shape of the shock correctly and built for it rather than waiting it out. This one's shape is a stack of durable policy conditions, not a single event with a known end date. Planning for a rebound is reasonable. Planning for a rebound on last cycle's timeline is not.
Bibliography
- ESA Insights Library, internal corpus; no public URL.
- USDA Economic Research Service, "Food Spending Adjustments During Recessionary Times," Amber Waves, September 2011. View source
- Nation's Restaurant News, "Recession puts dent in U.S. restaurant count" (NPD Group data). View source
- CBS News, "Recession Took A Bite Of Restaurant Sales," 2008. View source
- NBC News, "Restaurants hit by sales drop, high costs in 2008." View source
- QSR Magazine, "NRA: 'Modest Sales Growth in 2009.'" View source
- Micheline Maynard, "Three Ways Restaurants Have Changed Since The Great Recession," Forbes, July 17, 2018 (citing MasterCard SpendingPulse). View source
- Restaurant Business, "10 ways restaurants have changed since the Great Recession." View source
- Restaurant Business, "The COVID pandemic in 7 charts." View source
- S&P Global Market Intelligence, "Dining out: December restaurant sales decline, capping off a year of crisis," January 2021. View source
- National Restaurant Association, "Nearly 400K restaurant jobs were lost in December" (December 2020 jobs report). View source
- Restaurant Business, "Restaurants lost 372,000 jobs last month." View source
- Congressional Research Service, "SBA Restaurant Revitalization Fund Grants" (IF11819), updated August 15, 2022. View source
- Restaurant Business, "How the business has, and has not, changed since the pandemic." View source
- The Economist, "The Economic Costs of Trump's Immigration Crackdown" (excerpted via Political Wire), August 28, 2026. View source
- Axios, on record diesel prices and food transportation, September 11, 2026. View source
- Reuters, "Screwworm border closure fuels beef boom in Mexico, gloom in Texas" (via U.S. News), June 6, 2026. Also carried by the Jefferson City News-Tribune and Sight Magazine. View source
- CNN Business, "What screwworm means for your beef prices," June 9, 2026. View source
- Food Safety Magazine, "FDA, USDA, CDC continue to lose staffers in fiscal year 2026." View source
- FoodNavigator, "FDA and USDA staff cuts under Trump raise food safety risks," February 16, 2026. View source
- Grocery Dive, "How SNAP changes could impact grocers" (citing the National Grocers Association's reading of CBO). View source
- Harvard Joint Center for Housing Studies, "High Costs and Slumping Demand Squeeze Housing; Affordable Units Remain in Short Supply" (press release). View source
- USDA Economic Research Service, Food Price Outlook, Summary Findings. View source
- National Restaurant Association, 2026 State of the Restaurant Industry. View source
- National Restaurant Association, "GLP-1 and restaurants: shifting habits, not shrinking demand." View source
- FTI Consulting, "GLP-1 Drugs Are Rewriting the Rules of Food." View source
- CNBC, on GLP-1 diets and restaurants, March 21, 2026. View source
- Food Business News, "GLP-1 users taking more share of food, beverage market" (Circana research). View source
- Specialty Food Association, The Food Institute & MenuData, 2026 Specialty Food Outlook (full PDF supplied directly; charts cite Ipsos and University of Michigan). Public landing page: View source
- Axios, on the closing K-shaped gap in spending and income growth, August 11, 2026. View source
- CNBC, "Is the economy K-shaped or C-shaped?," August 25, 2026. View source
- CNBC, "'E-shaped' economy is replacing a K-shaped one," March 6, 2026. View source
- Fortune, on Heather Long and the "E-shaped" economy, May 10, 2026. View source
- National Restaurant Association, Consumer Outlook (economic indicators). View source