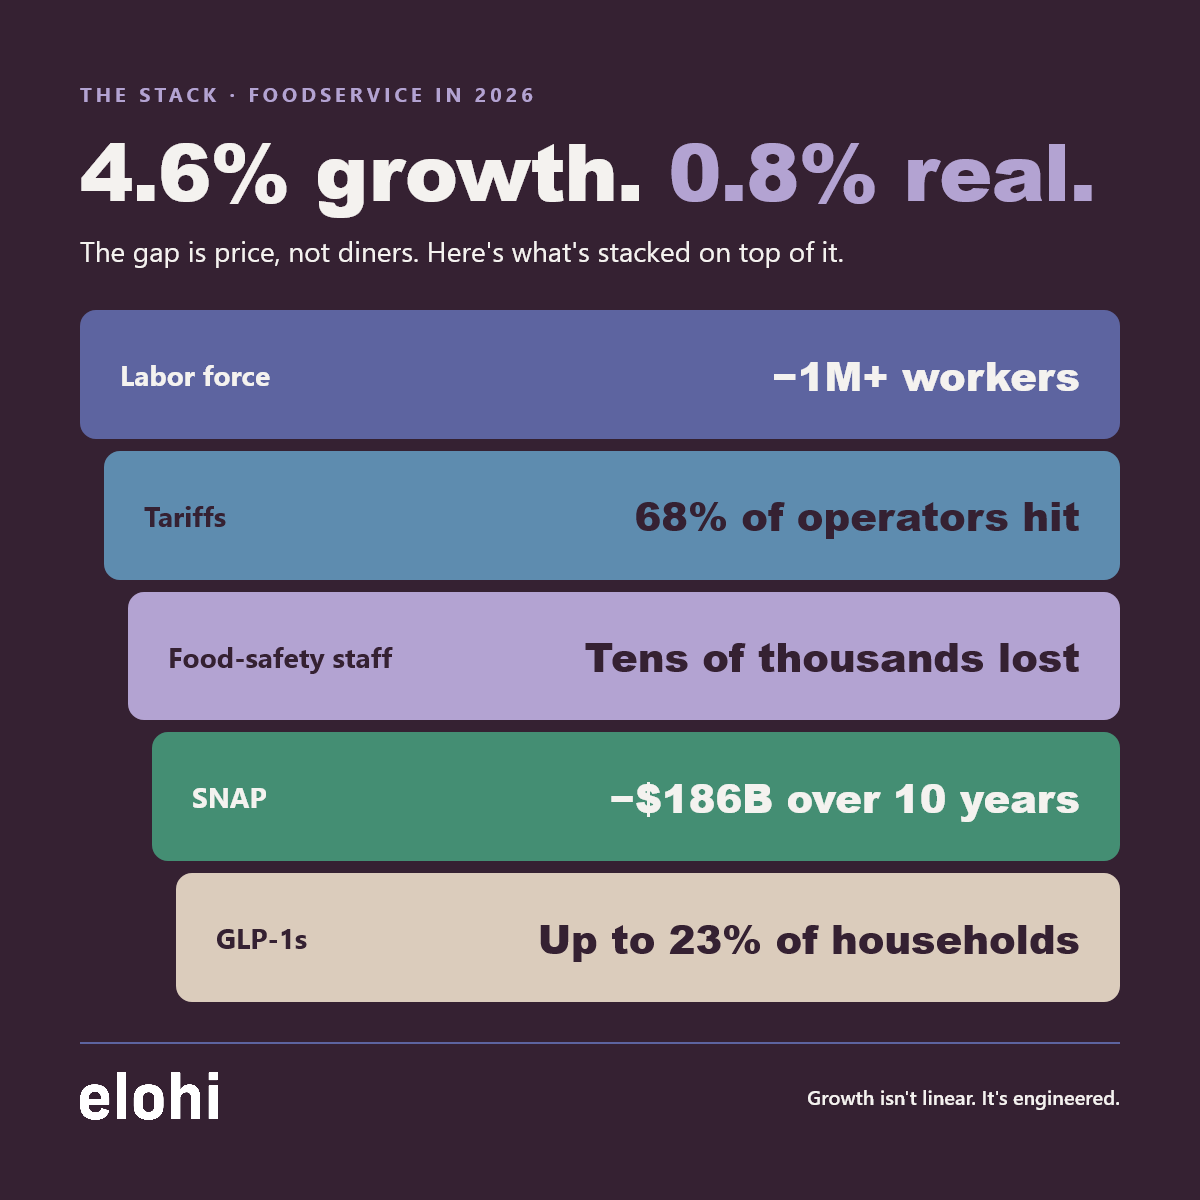
Start with one number. Across the foodservice industry in 2025, real, inflation-adjusted growth came in at 0.8%. Nominal growth, the number that shows up in a headline, was 4.6% [1]. The gap between those two numbers isn't growth. It's price. Most of what the industry is calling "resilience" this year is consumers paying more for the same plate, not ordering more of them.
That's the backdrop. Layered on top of it are at least five separate policy decisions, made at the federal level over the past eighteen months, each of which is measurably raising costs or suppressing demand somewhere in this value chain. None of them are acts of God. Diesel prices are the exception, that one's a war. Everything else on this list has a name attached to it, a rule number, a budget line. The trade press covers each one as its own story. Nobody's running the thread through all of them at once. That's what this piece is for.
To be fair to the other side of each of these arguments: supporters of worksite enforcement would say tightened labor markets and higher wages are the point, not a side effect. Supporters of the screwworm border closure would say a flesh-eating livestock parasite is exactly the kind of risk a country closes its border over, cost be damned. Nobody sensible disputes that food safety budgets have to be weighed against other federal priorities. These are legitimate trade-offs, not conspiracies. What's missing from the public conversation isn't an argument that the trade-offs are wrong, it's an honest accounting of what they cost, added up, in one place, for the people who run restaurants and the companies that supply them.
The people are the first thing to go
The National Restaurant Association puts immigrant ownership of U.S. restaurants at 36% [2]. Worksite enforcement escalated through 2025 and into 2026, and the effects on staffing have been immediate rather than gradual. A University of California-affiliated study found businesses in Orange County lost $58.9 million in economic output over eight weeks following intensified raids, with some hospitality businesses reporting foot traffic down as much as 80% [3, 4]. In Chicago, "Operation Midway Blitz" cut dine-in sales at some neighborhood restaurants by up to 60% and forced at least one permanent closure [4, 5].
This isn't only a local-business story. The Economist recently laid out the macro version in plain terms: the U.S. labor force has shrunk by more than a million people since January 2026, and the Congressional Budget Office now expects roughly 2.3 million fewer working-age adults in the country this year than it projected at the start of 2025 [6, 7]. Job growth has slowed from an average of 230,000-plus per month in 2022--24 to roughly 30,000 a month now [6]. Goldman Sachs estimates net immigration is down close to 80% from its 2010s baseline [8]. Deutsche Bank's George Saravelos called the immigration collapse "a far more sustained negative supply shock for the economy than tariffs", a claim from a bank, not an advocacy group [9].
None of this is contested at the level of the balance sheet. What's contested, or rather, what's simply not said, is which policy is doing it. The National Restaurant Association's own 2026 State of the Industry report calls, in a single sentence, for "sustained workforce development and immigration reform" [10, 11]. It doesn't mention worksite enforcement, ICE, or raids by name. That's not an oversight. It's the industry's largest trade group choosing the softest available language for the thing hurting its members' staffing the most. (INFERRED: I can't prove that word choice was deliberate, but it's a notable gap between what the data shows and what the association is willing to say about why.)
The truck costs more before it leaves the yard
Diesel hit a nominal record of $6.05 to $6.08 a gallon in September 2026, up 63% year-over-year, after the U.S.-Iran conflict disrupted shipping through the Strait of Hormuz [12, 13]. Brown University's real-time tracker estimates the resulting diesel-cost increase had added about $46 billion in costs as of early September, or roughly $348 per U.S. household [14, 15]. RSM's economists calculate that diesel prices explain 46% of the variation in trucking producer prices going back to 2004 [16, 17]. This one genuinely isn't a domestic policy story, it's a war overseas. But it's still landing on the same distributors and manufacturers who are absorbing everything else on this list at the same time.
Then there's the cattle. New World screwworm was confirmed in Texas in June 2026, the first U.S. case in sixty years, at the same moment the national cattle herd sat at a 74-year low and retail beef hit a record $9.64 a pound [18, 19]. The U.S.-Mexico livestock border has been closed on and off since November 2024 as a screwworm containment measure, cutting off a supply of more than a million cattle a year that U.S. feedlots used to fatten before slaughter [19, 20]. Tyson permanently shut a beef plant in Nebraska and scaled back operations in Amarillo, citing the tighter supply [19]. Meanwhile, and this is the detail nobody's connecting, beef tallow menu penetration more than doubled in 2025, up 113% year-over-year, as seed-oil skepticism drove operators back toward animal fat, according to MenuData research cited in the Specialty Food Association's 2026 outlook [21]. (INFERRED: neither the cattle story nor the tallow story references the other, but they're the same commodity moving in opposite directions at the same time, rising demand for a byproduct of an animal that's simultaneously the scarcest input in the chain.)
Layer tariffs on top. Steel and aluminum packaging tariffs sit at 50% on imports from Canada and China, according to the Food Marketing Institute [22, 23]. Tomato prices rose 39.7% year-over-year after tomatoes lost a tariff exemption they'd previously held [23]. Sixty-eight percent of restaurant operators told the National Restaurant Association that tariffs directly drove higher food or beverage costs last year [10].
The people checking your food are disappearing, too
Between 2025 and 2026, the FDA lost 3,859 employees, and USDA lost more than 19,000 [24, 25]. The Food Safety and Inspection Service is down 913 positions across both years; APHIS lost 20% of its staff in the first three months of 2025 alone [24, 26]. The FDA's proposed FY2026 budget cuts Field Laboratory Operations, the capacity that actually tests food samples, by 54.4% [25]. Foreign facility inspections dropped by nearly half in March 2025 compared with the prior two-year average, according to a ProPublica analysis [27]. The National Advisory Committee on Microbiological Criteria for Foods, which was mid-review on Listeria standards and infant-formula contamination guidance, was disbanded before finishing either [26].
At the same time, FDA logged 342 food enforcement events in the first nine months of 2026, 126 of them Class I, the agency's most serious designation. Undeclared allergens accounted for 133 of those events, Salmonella for 52, foreign material for 40 [28]. Several recent recalls trace back to product shipped without the federal inspection it was supposed to have had, a repackager in New England shipping frozen buffalo chicken under a false inspection mark, a raw-beef importer skipping required reinspection [29]. These aren't hypothetical failure modes. They're what shows up when the inspection layer thins out. I'm not going to claim a direct causal line between fewer inspectors and those specific recalls, that's not a claim the data supports on its own. But an agency that has lost a fifth of its enforcement staff while restaurants and manufacturers keep getting product recalled for lacking inspection is not a coincidence anyone in this industry should be comfortable with.
Consumers have less to give than the traffic numbers suggest
Layer the demand side on top of the supply side. Renter households cost-burdened by housing now number 22.7 million, or 49% of all renters, per Harvard's Joint Center for Housing Studies, up 2.3 million since 2019 [30, 31]. Property taxes are up 31% and homeowners' insurance up 72% over the same stretch [30, 31]. Food-away-from-home inflation ran at 3.4% year-over-year as of July 2026, per USDA [32]. Only 39% of Americans rate the U.S. economic situation "very good" or "somewhat good," according to Ipsos polling cited in the Specialty Food Association's 2026 report, and University of Michigan's consumer sentiment index still sits nearly 30% below where it was a year ago [21].
The "K-shaped economy" framing that's dominated 2026 coverage is itself contested, and worth being honest about rather than flattening into a talking point [33, 34]. Bank of America has argued the divide is narrowing, lower-income wage growth outpaced higher-income growth for the first time since December 2024, a shift the bank calls the "great convergence" [35, 36]. Economist Heather Long counters that the picture is now "E-shaped", three tiers, with a nervous, softening middle class rather than a clean high/low split [37, 38]. Goldman Sachs has suggested the whole narrative was overstated; Moody's Mark Zandi has said roughly half of U.S. states are effectively in recession already, with lower-income households "hanging on by their fingertips" [39]. Reasonable economists disagree about the shape of the problem. None of them disagree that it exists.
The labor market adds its own layer of false comfort. The headline unemployment rate sat at 4.2% in mid-2026, not alarming on its face [40]. But that number improved mostly because people left the workforce, not because hiring picked up; labor force participation fell to its lowest level since March 2021 [40, 41]. Hospitality shed jobs even as the broader economy grew: hotels alone cut 21,700 positions in a single month this summer [42, 43]. A stable-looking unemployment rate sitting on top of a shrinking labor force and a hospitality sector losing jobs is not the same thing as a healthy labor market, whatever the topline number implies.
Then there's the safety net. The One Big Beautiful Bill Act cuts SNAP by $186 billion over ten years. The Congressional Budget Office projects 2.4 million fewer Americans receiving food assistance in an average month going forward [44]. During the 43-day government shutdown in late 2025, when SNAP payments were delayed rather than cut, Numerator's data showed limited-service restaurant desserts among the categories that pulled back hardest, direct evidence that a safety-net disruption shows up on a fast-food receipt, not just a grocery one [45, 46].
Layer GLP-1 medications on top of all of that, and you get a genuinely strange situation: a portion of the consumer base is being priced out of dining while another portion is being medically induced to eat less of it, at the same time. Estimates of how many Americans are currently on a GLP-1 range from 12.5% (National Restaurant Association) to 18% (FTI Consulting) to 23% of households (Circana), a spread wide enough that the industry doesn't even agree on the size of the thing it's trying to plan around [47, 48, 49, 50].
Nobody's saying all of this in one place
Here's the part that should bother anyone who reads foodservice trade coverage regularly: every piece of this is being reported somewhere. It's just never in the same place. The Economist, Goldman Sachs, and Deutsche Bank will say the immigration-labor connection plainly, in GDP terms, because that's their beat [6, 8, 9]. Food-and-beverage trend reports, including good ones, like the Specialty Food Association's 2026 outlook, will chart tariffs and consumer sentiment directly, because that's theirs [21]. What nobody does is bring the macro diagnosis down to the line level: this is why your dessert orders are soft, this is why the prep line is short two people, this is why the beef on your menu costs 13% more than it did a year ago.
There are exceptions, and they're worth noting because they show the industry can say this plainly when it wants to. R-CALF's Bill Bullard called the industry's dependence on Mexican cattle imports "a threat to national security" [20]. IDDBA's Anne-Marie Roerink, presenting the association's 2026 trends, told attendees that most of what looks like category growth right now "is not a race to the bottom" on price, it's inflation wearing growth's clothes [51, 52, 1]. These are real people, at real companies, saying real things. They just don't get said together.
Who actually pays
Distributed across the value chain, this stack doesn't land evenly. Consumers are trading down and visiting less, with GLP-1 suppressing baseline demand on top of the price sensitivity. Operators are absorbing it worst on the margin line, 42% reported their restaurant was not profitable last year, per the National Restaurant Association [10]. Distributors are the shock absorber for freight costs and cattle-supply chaos, and they're leaning harder on their own private label to protect margin: Sysco's brand penetration sits at 35.8% of total case volume and better than 46% among local, independent customers [53, 54, 55]; US Foods is at 34% and rising [56]. Manufacturers are caught between packaging tariffs, a thinner federal inspection system, and a mandate to reformulate toward protein and fiber for a customer whose appetite is, in a growing number of cases, being pharmacologically suppressed [57, 58]. The same margin logic is visible one level up the chain, where private label is quietly becoming the industry's shared hedge: U.S. private-label sales hit a record $282.8 billion in 2025, growing nearly three times as fast as national brands, and the share of shoppers loyal only to national brands collapsed from 21% to 10% in under a year, per Circana and Zappi data distributed by the Private Label Manufacturers Association [59, 60]. That's not a branding trend. It's what a supply chain looks like when every node in it is protecting margin at once.
None of this is inevitable, and none of it is abstract. It's the sum of specific, nameable decisions, a worksite enforcement posture, a tariff schedule, a staffing reduction at two federal agencies, a benefits cut written into a piece of legislation, made by people who could, in principle, choose differently. Some of these choices may well be defensible on their own terms; the screwworm border closure probably was. But defensible one at a time is not the same thing as costless in aggregate, and right now this industry is the one absorbing the aggregate.
The industry doesn't need a bailout. It needs the people setting these policies to understand, in plain terms, what they're actually doing to the businesses that feed the country three times a day, and it needs its own trade groups to say so a little less carefully than "workforce development and immigration reform."
Bibliography
- ESA Insights Library, internal corpus; no public URL.
- National Restaurant Association, "New Association report provides a demographic profile of restaurant owners," April 16, 2026 (the underlying data brief; U.S. Census Bureau data). View source
- Stuart Anderson, "New Research Finds ICE Immigration Raids Harm The Economy," Forbes, May 19, 2026. View source
- U.S. Senate Committee on Small Business (minority staff), "Federal Fear Campaign: How Trump's ICE Raids Are Threatening Small Businesses Across America." View source
- Poached, "After the Headlines Fade: Restaurants Are Still Dealing With the Immigration Crackdown," May 5, 2026. View source
- The Economist, "The Economic Costs of Trump's Immigration Crackdown" (excerpted via Political Wire), August 28, 2026. View source
- Axios, on immigration, population growth and employment data, May 29, 2026. View source
- Fortune, on Goldman Sachs' immigration and labor-market analysis, February 17, 2026. Also reported by Yahoo Finance and AOL (near-identical text). View source
- Fortune, on Deutsche Bank's George Saravelos and the immigration supply shock, June 8, 2025. View source
- National Restaurant Association, 2026 State of the Restaurant Industry. View source
- National Restaurant Association, 2026 State of the Restaurant Industry, full report PDF (via WTOP). View source
- Axios, on record diesel prices and food transportation, September 11, 2026. View source
- Fortune, on record diesel prices and groceries, September 4, 2026. View source
- Brown University, Watson School of International and Public Affairs (Climate Solutions Lab), Iran War Energy Cost Tracker (live; figures update daily). View source
- CNN, "Americans are footing a $100 billion energy bill from the Iran war," September 8, 2026 (reporting the Brown tracker's diesel-only estimate). View source
- RSM, "Diesel, trucking, food prices and inflation." View source
- RSM, "Market Minute: Diesel, trucking, food and inflation." View source
- CNN Business, "What screwworm means for your beef prices," June 9, 2026. View source
- Reuters, "Screwworm border closure fuels beef boom in Mexico, gloom in Texas" (via U.S. News), June 6, 2026. Also carried by the Jefferson City News-Tribune, BusinessWorld and Sight Magazine. View source
- CNN, "The US-Mexico cattle border is reopening. Not every American rancher is celebrating," August 22, 2026 (includes Bill Bullard interview). View source
- Specialty Food Association, The Food Institute & MenuData, 2026 Specialty Food Outlook (full PDF supplied directly; includes MenuData tallow data and Ipsos / University of Michigan sentiment charts). Public landing page: View source
- The Shelby Report, "FMI briefing sheds light on likely impacts of tariffs," August 18, 2025. View source
- FoodNavigator, "How will tariffs impact food in 2026?," January 6, 2026. View source
- Food Safety Magazine, "FDA, USDA, CDC continue to lose staffers in fiscal year 2026." View source
- FoodNavigator, "FDA and USDA staff cuts under Trump raise food safety risks," February 16, 2026. View source
- Food Safety Magazine, "A 2025 timeline of US federal food safety changes under the Trump admin." View source
- Food Safety Magazine, "Analysis shows FDA foreign facility inspections hit historic low after Trump admin cuts" (ProPublica analysis). View source
- RecallBench, "2026 recall statistics and trends." View source
- USDA Food Safety and Inspection Service, Recalls & Public Health Alerts. View source
- Harvard Joint Center for Housing Studies, "High Costs and Slumping Demand Squeeze Housing; Affordable Units Remain in Short Supply" (press release). View source
- Harvard Graduate School of Design, "State of the Nation's Housing 2026 finds affordability challenges," June 2026. View source
- USDA Economic Research Service, Food Price Outlook, Summary Findings. View source
- Federal Reserve Bank of New York, Liberty Street Economics, "Explaining the K-Shaped Economy: What's Behind the Divide?," May 2026. View source
- CNN Business, on the K-shaped economy debate, August 10, 2026. View source
- Axios, on the closing K-shaped gap in spending and income growth, August 11, 2026. View source
- CNBC, "Is the economy K-shaped or C-shaped?," August 25, 2026. View source
- Fortune, on Heather Long and the "E-shaped" economy, May 10, 2026. View source
- CNBC, "'E-shaped' economy is replacing a K-shaped one," March 6, 2026. View source
- Fortune, on Goldman Sachs vs. Moody's and the K-shaped economy, April 24, 2026. View source
- CNBC, "U.S. job creation cools in June with payrolls growth of just 57,000; unemployment rate at 4.2%," July 2, 2026. View source
- CNBC, "Job seekers giving up: Labor force participation rate falls to lowest in 50 years, outside of Covid era," July 2, 2026. View source
- Nation's Restaurant News / Restaurant Business, "Restaurants and bars shed a lot of jobs in June." View source
- National Restaurant Association, Total Restaurant Industry Jobs (economic indicators). View source
- Grocery Dive, "How SNAP changes could impact grocers" (citing the National Grocers Association's reading of CBO). View source
- Numerator, "SNAP Spending in 2026." View source
- FoodNavigator, "US grocery sales fall as SNAP changes shift shopping," August 21, 2026. View source
- National Restaurant Association, "GLP-1 and restaurants: shifting habits, not shrinking demand." View source
- FTI Consulting, "GLP-1 Drugs Are Rewriting the Rules of Food." View source
- Food Business News, "GLP-1 users taking more share of food, beverage market" (Circana research). View source
- CNBC, on GLP-1 diets and restaurants, March 21, 2026. View source
- The Shelby Report, "IDDBA 2026: 3 Forces Reshaping Dairy, Deli, Bakery and 5 Ways to Win," June 8, 2026. View source
- Progressive Grocer, IDDBA 2026 trends reshaping the dairy, deli and bakery aisle. View source
- Sysco Corp., Form 10-K, fiscal year 2025 (SEC EDGAR). View source
- Sysco Corp., Form 8-K, Q4 FY2025 press release (SEC EDGAR). View source
- Sysco Corp., Form 8-K, Q2 FY2026 press release (SEC EDGAR). View source
- US Foods Holding Corp., Form 10-K, fiscal year 2025 (SEC EDGAR). View source
- ESA Insights Library, internal corpus; no public URL.
- ESA Insights Library, internal corpus; no public URL.
- Retail Dive, on PLMA's 2025 private-label sales record. View source
- Circana, "Circana research reveals U.S. private label CPG sales reach $330 billion." View source